

Project information
- Problem: Analysis, Portfolio Optimization
- Area: Finance
- Learning technique: Statistic Optimization, Reinforcement Learning
- Tools: Python, Scipy, Git, Pandas, Bokeh
- Project date: September 2021 - December 2021
- Project URL: Portfolio Analysis
Portfolio Analysis
Libraries:
Dependences:
HMTL test sample
Try the test example here:
Demo for Portfolio Analysis - Colab Version
![]()
Contents
Description and Goal
This project born from the need to analyze your own financial portfolio, in order to make you well understand which are your next decision for the future investments.
You will be able to:
- analyze the stake for each financial category (ETF, Crypto, Stock, ecc.)
- analyze the historical data and the performance on your portfolio for each securities
- analyze the suggested portfolio optimization for each financial category
Dataset
For the current version (v1.0), two json files are needed in input for using the project functionalities:
ticker_details.json
This file contains all unique securities information. Each time you add a transaction, you need to have defined its ticker in this file.
Historical data will be automatically loaded basing on the tickers in the ticker_details.json file
[
  {
    "ticker_id": "AIAI.MI",                         Ticker from Yahoo Finance
    "ticker_name": "L&G Artificial Intelligence",   Short Description
    "isin":"IE00BK5BCD43",                          Ticker ISIN
    "instrument": "ETF",                            Arbitrary category
    "risk": 6,                                      Risk Value
    "fee": 0.49                                     Fee
  },
  {
    "ticker_id": "AIAI.MI",
    ...
  }
]
transactions.json
This file contains all the transactions of your portfolio
[
  {                  [BUY EXAMPLE]
    "date": "2021-04-23",       Transaction date
    "ticker_id": "ECAR.MI",     Ticker from Yahoo Finance
    "action": "buy",            'buy' or 'sell'
    "quantity": 19.0,           Quantity bought or sold
    "price": 6.391,             Price at transaction time
    "commission": 2.04,         Commission paid for the transaction
    "gain": null,               Gain from an eventual sell
    "spent": 123.469            Total spent for the transaction
  },
  {                  [SELL EXAMPLE]
    "date": "2021-09-20",
    "ticker_id": "WTEC.MI",
    "action": "sell",
    "quantity": 2.0,
    "price": 99.14,
    "commission": 2.06,
    "gain": 196.22,
    "spent": 0.0
  },
]
Historical data
The historical data for each securities are automatically downloaded, basing on the tickers defined in the ticker_details.json. This data are taken from Yahoo Finance and they include the following features: Open, Close, High, Low, Volume
Features
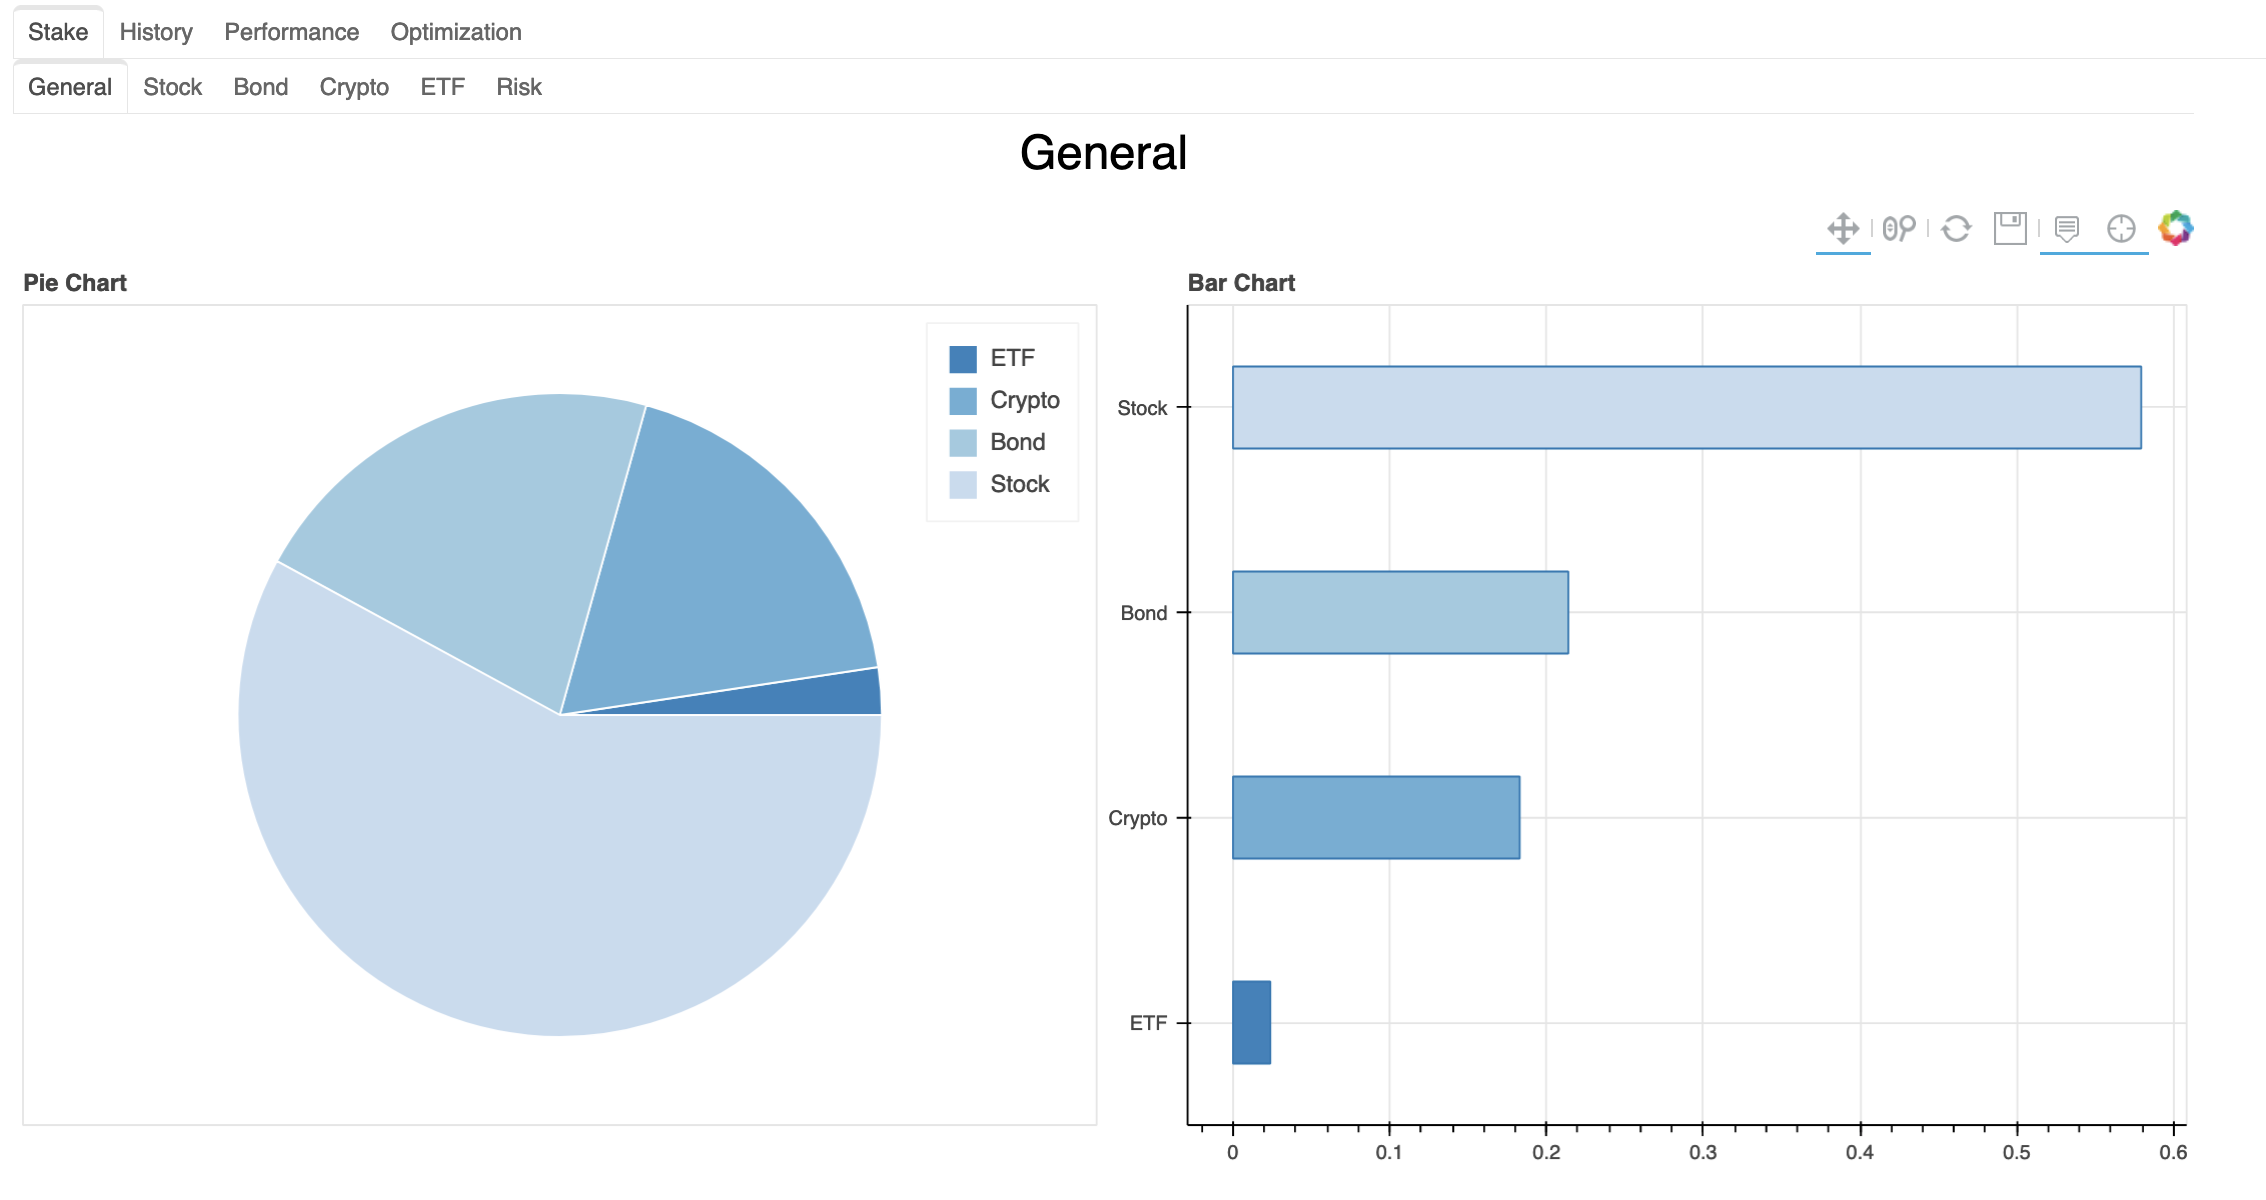
Stake Analysis
- It permits you to analyze the overall stake of the financial portfolio
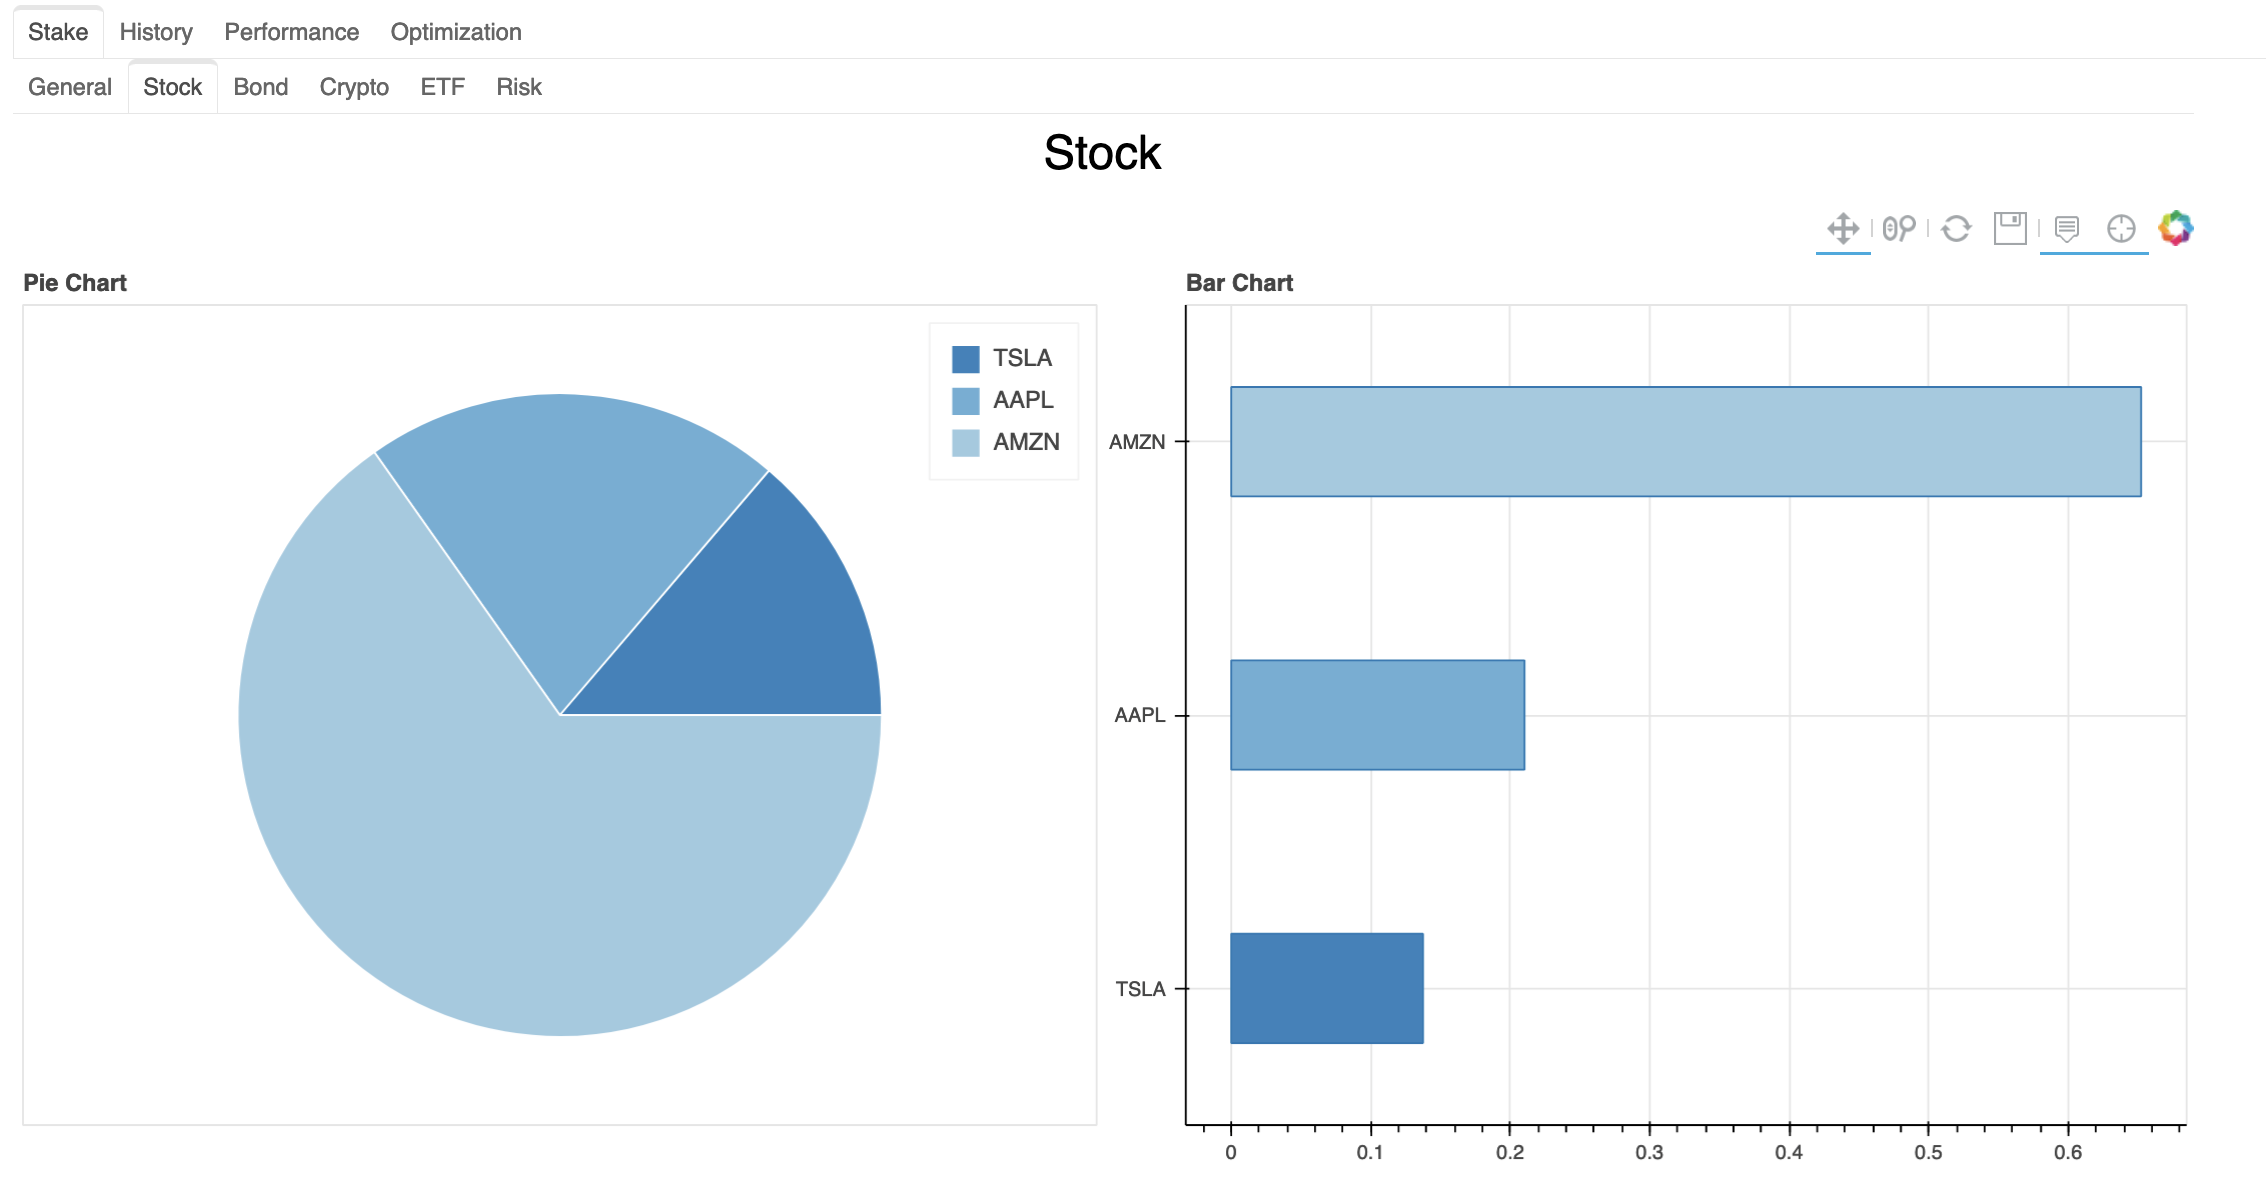
- In a more specific use case it could be useful to analyze also the stake relative to the instruments of portfolio. Here is an example of the stocks stake.
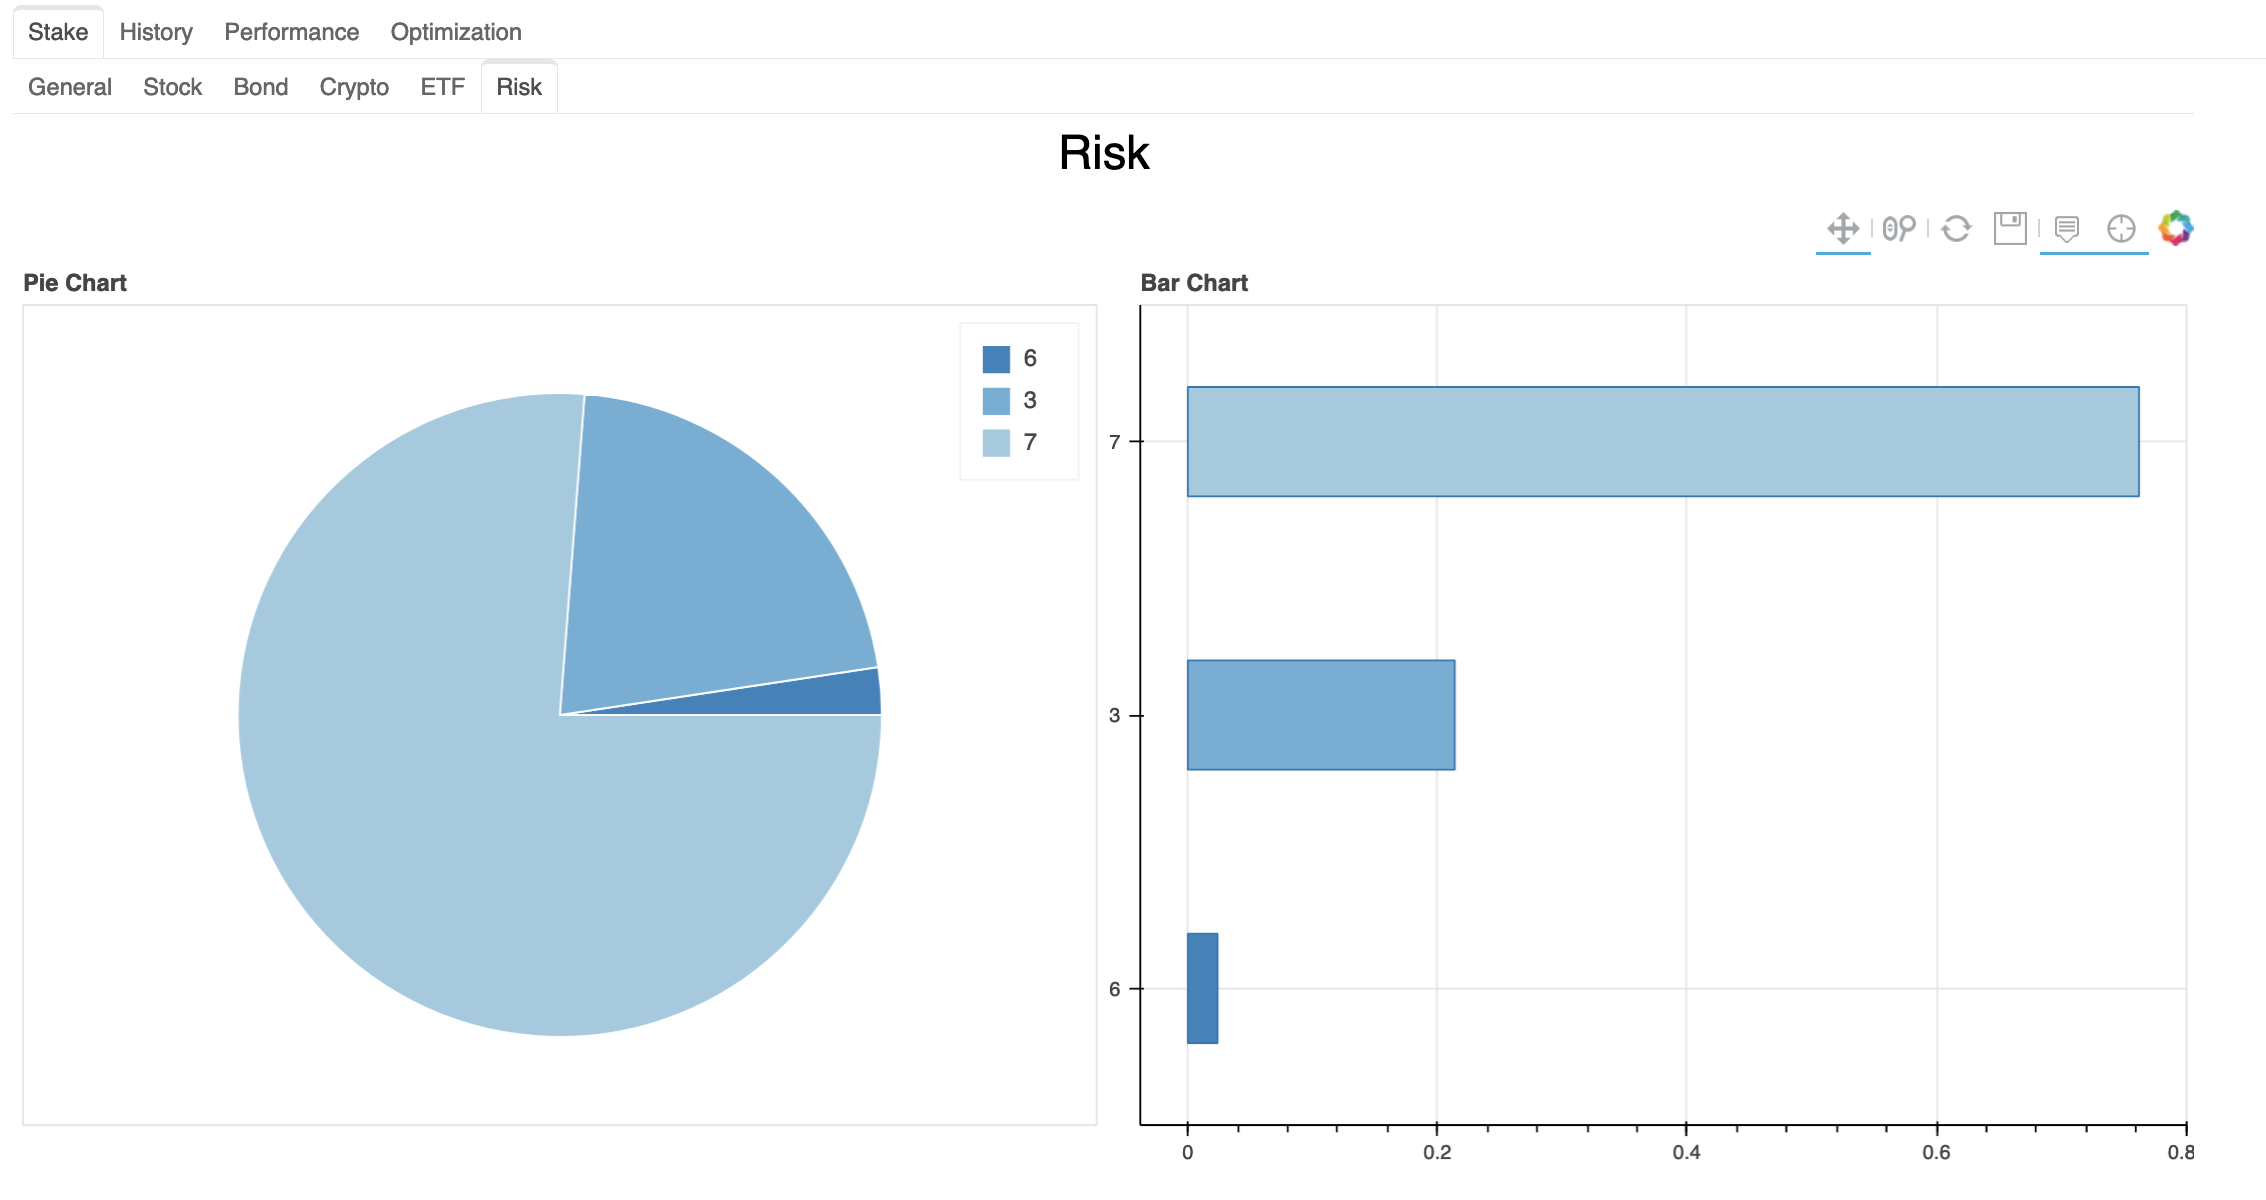
- Furthermore, defining the risk in the ticker_details, it is possible to analyze the stack by risk represented by the securities. An example of a risk stake is the following one.
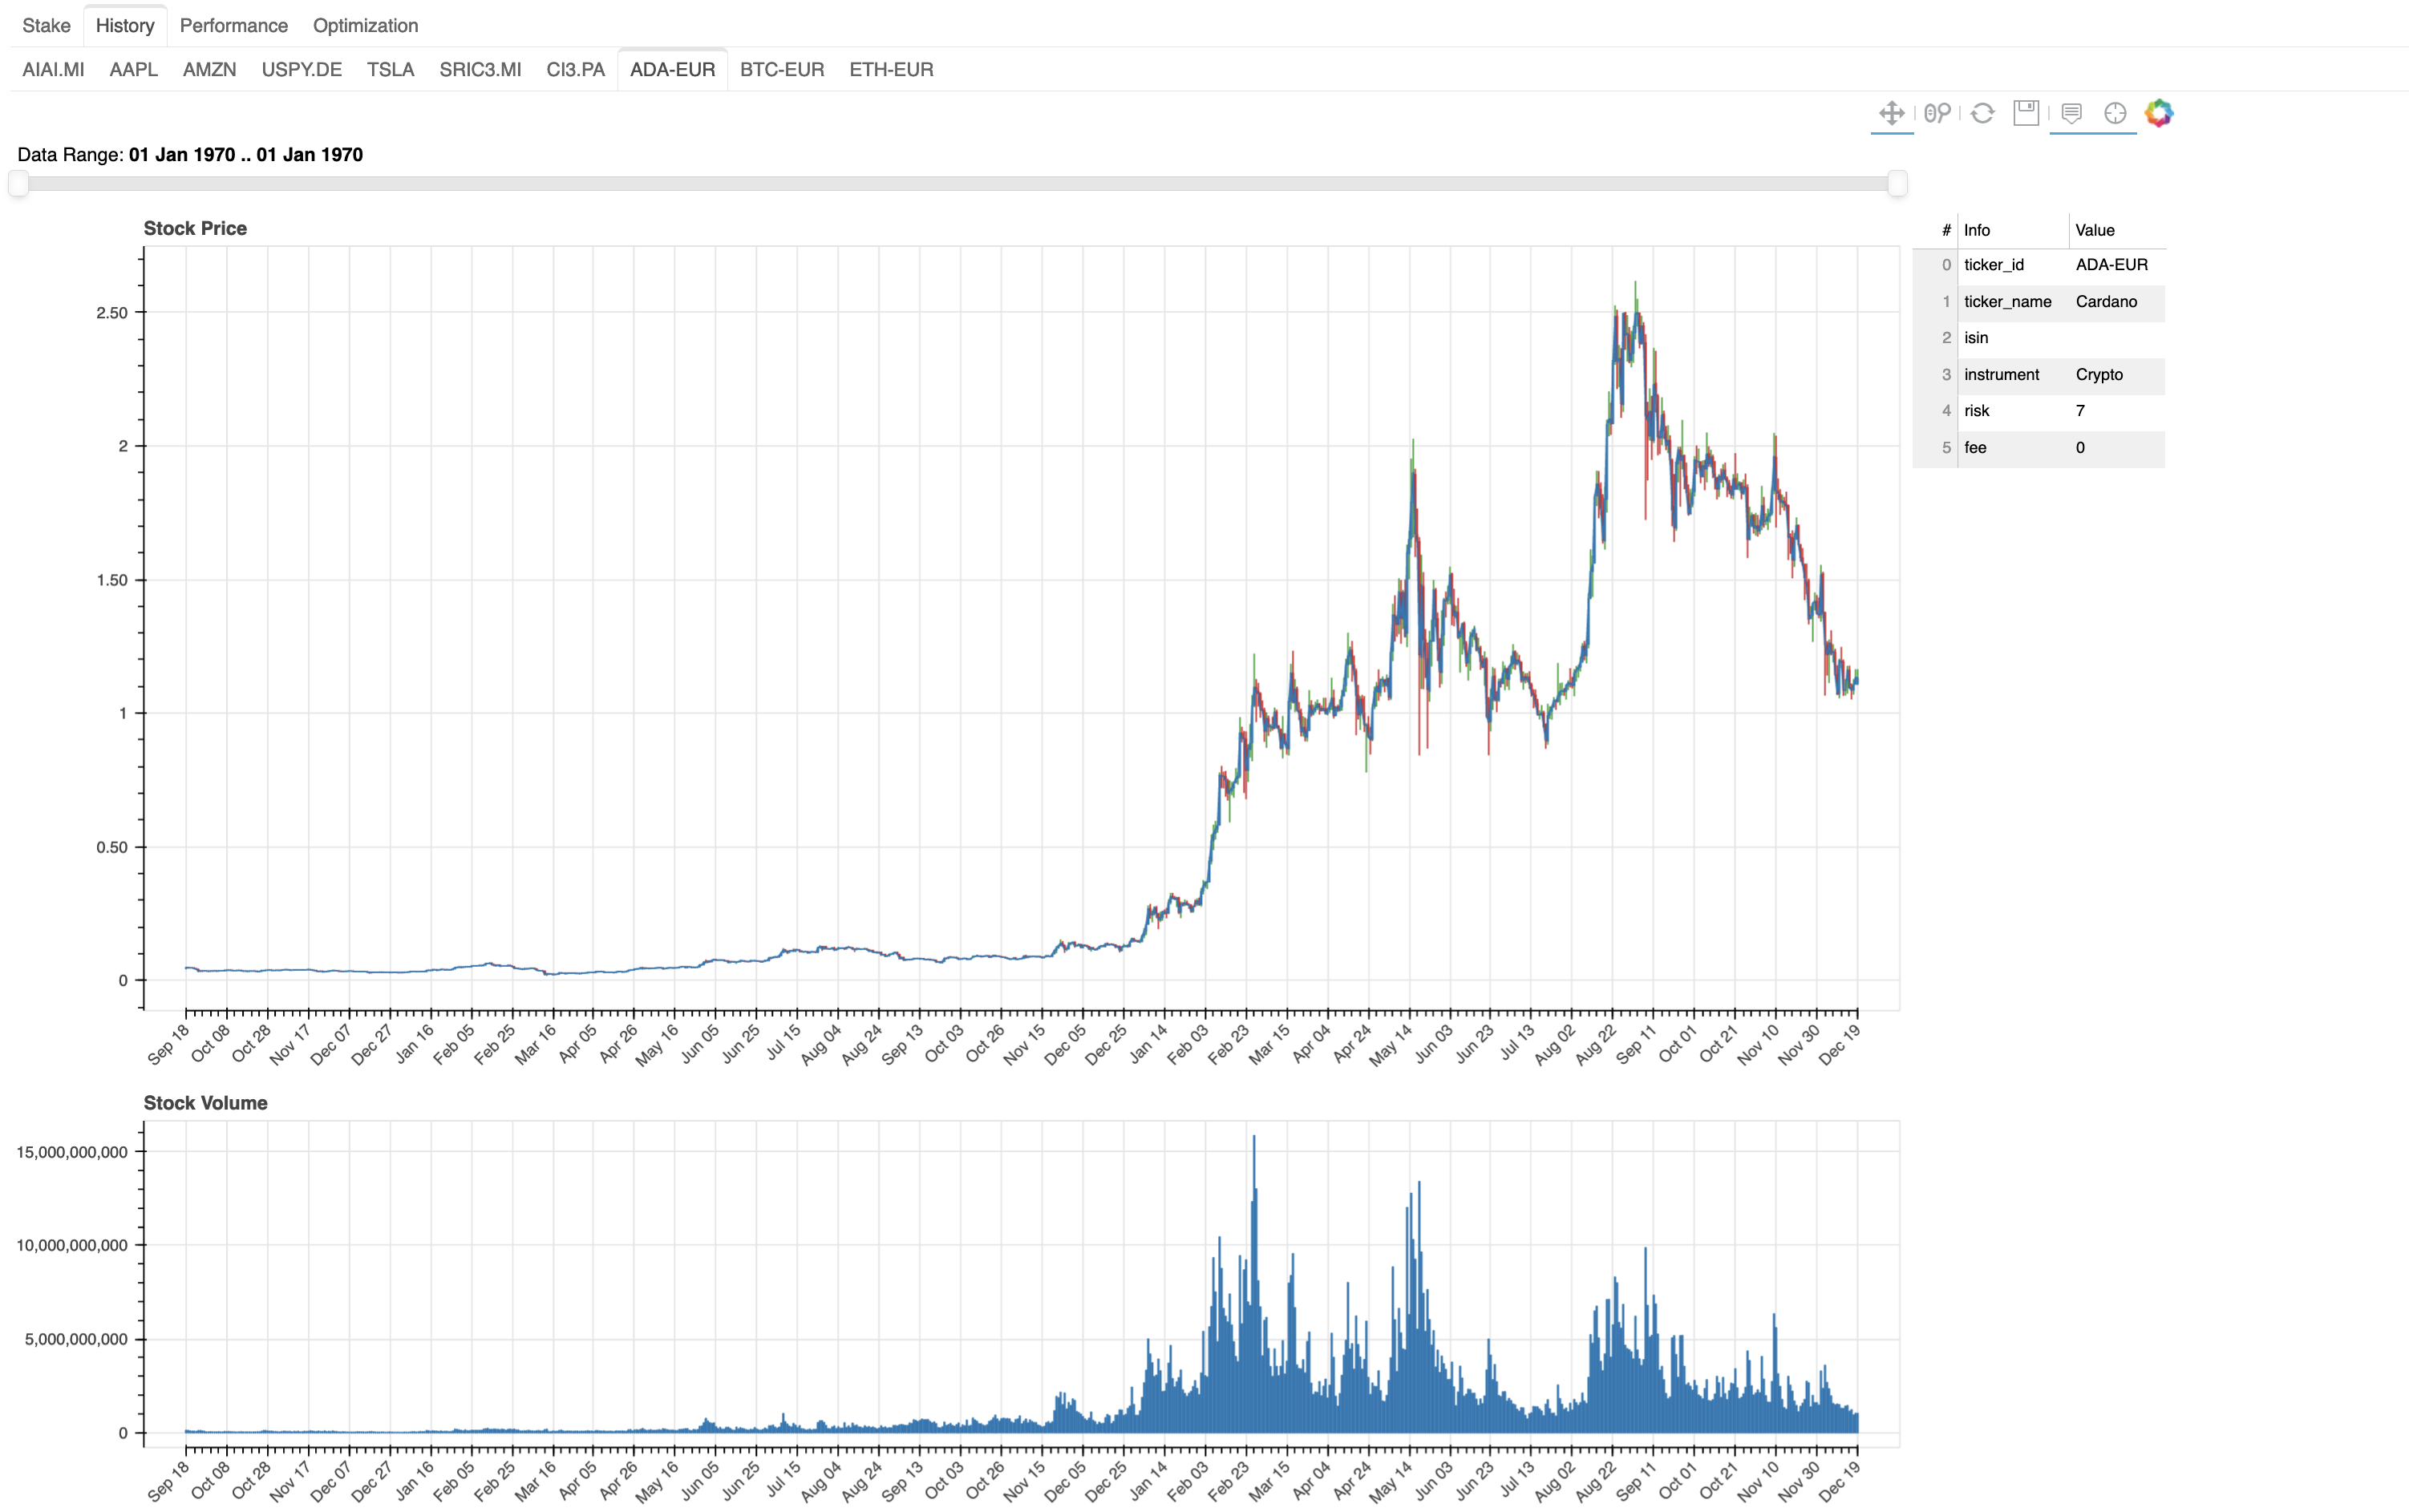
History Analysis
- This feature led to analyze the historical data for each security in your ticker_details.json. It shows the candlestick and the volume plots. Here are two examples of the view for some tickers (in this case AIAI.MI and ADA-EUR).
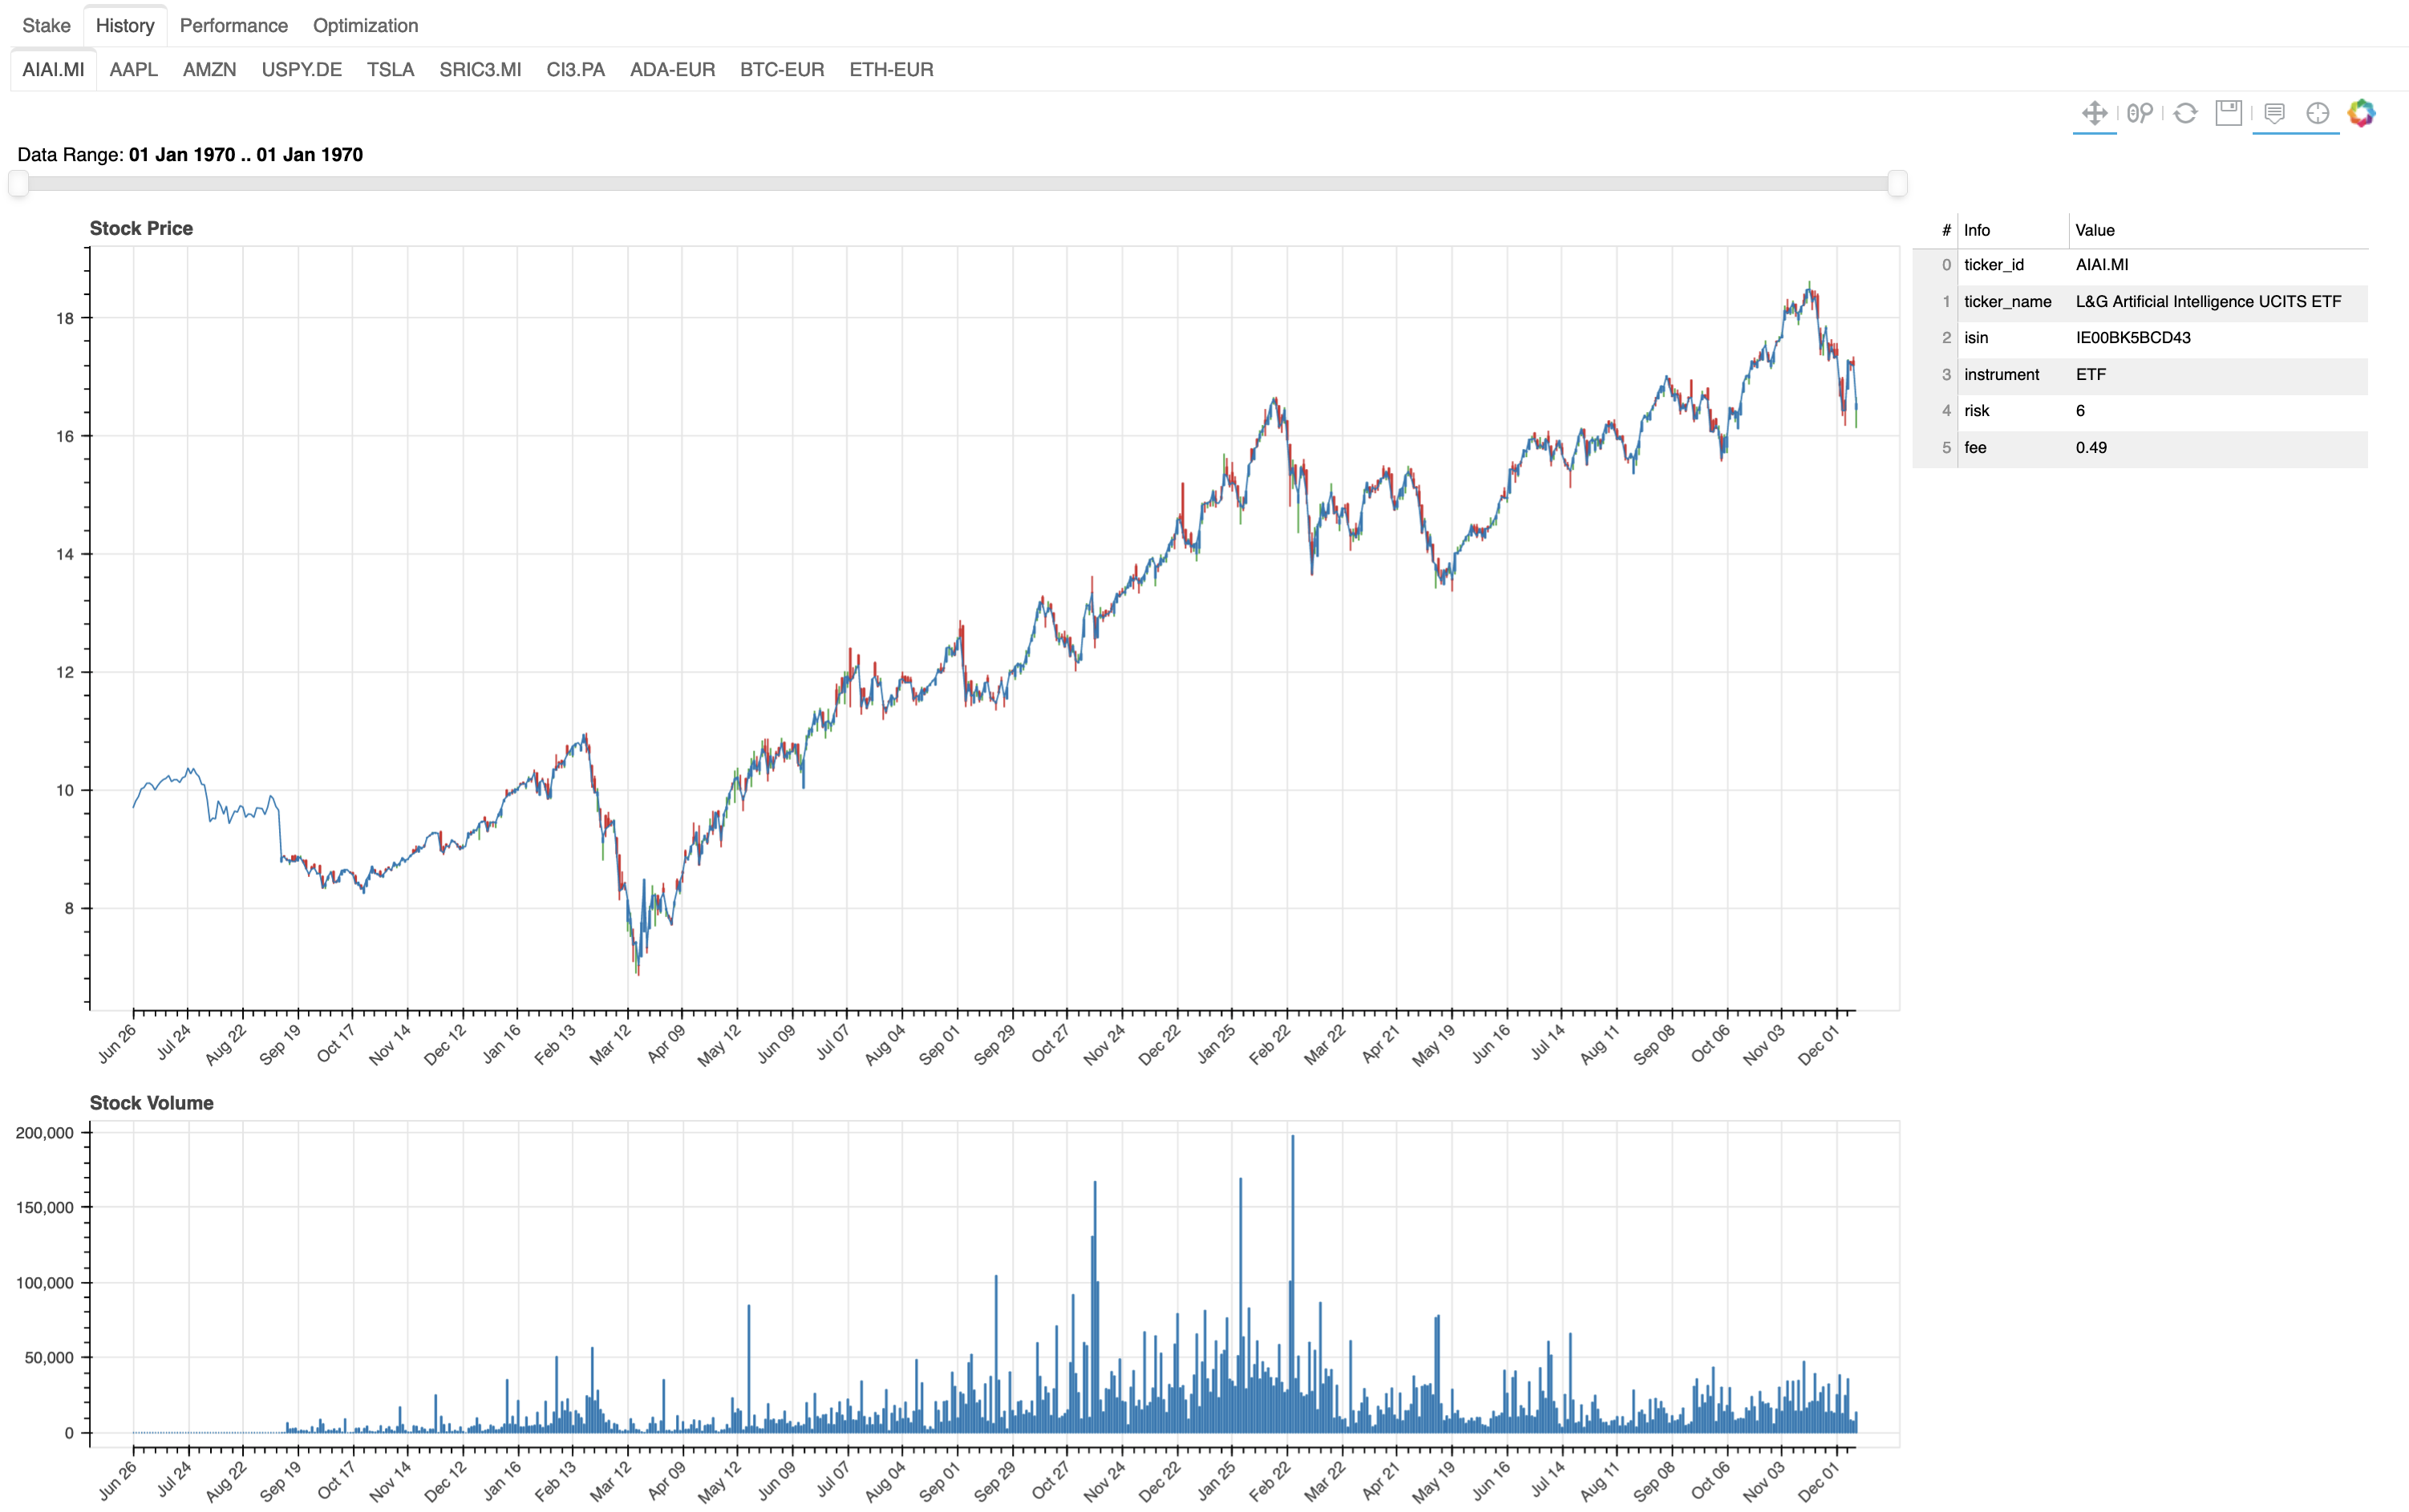
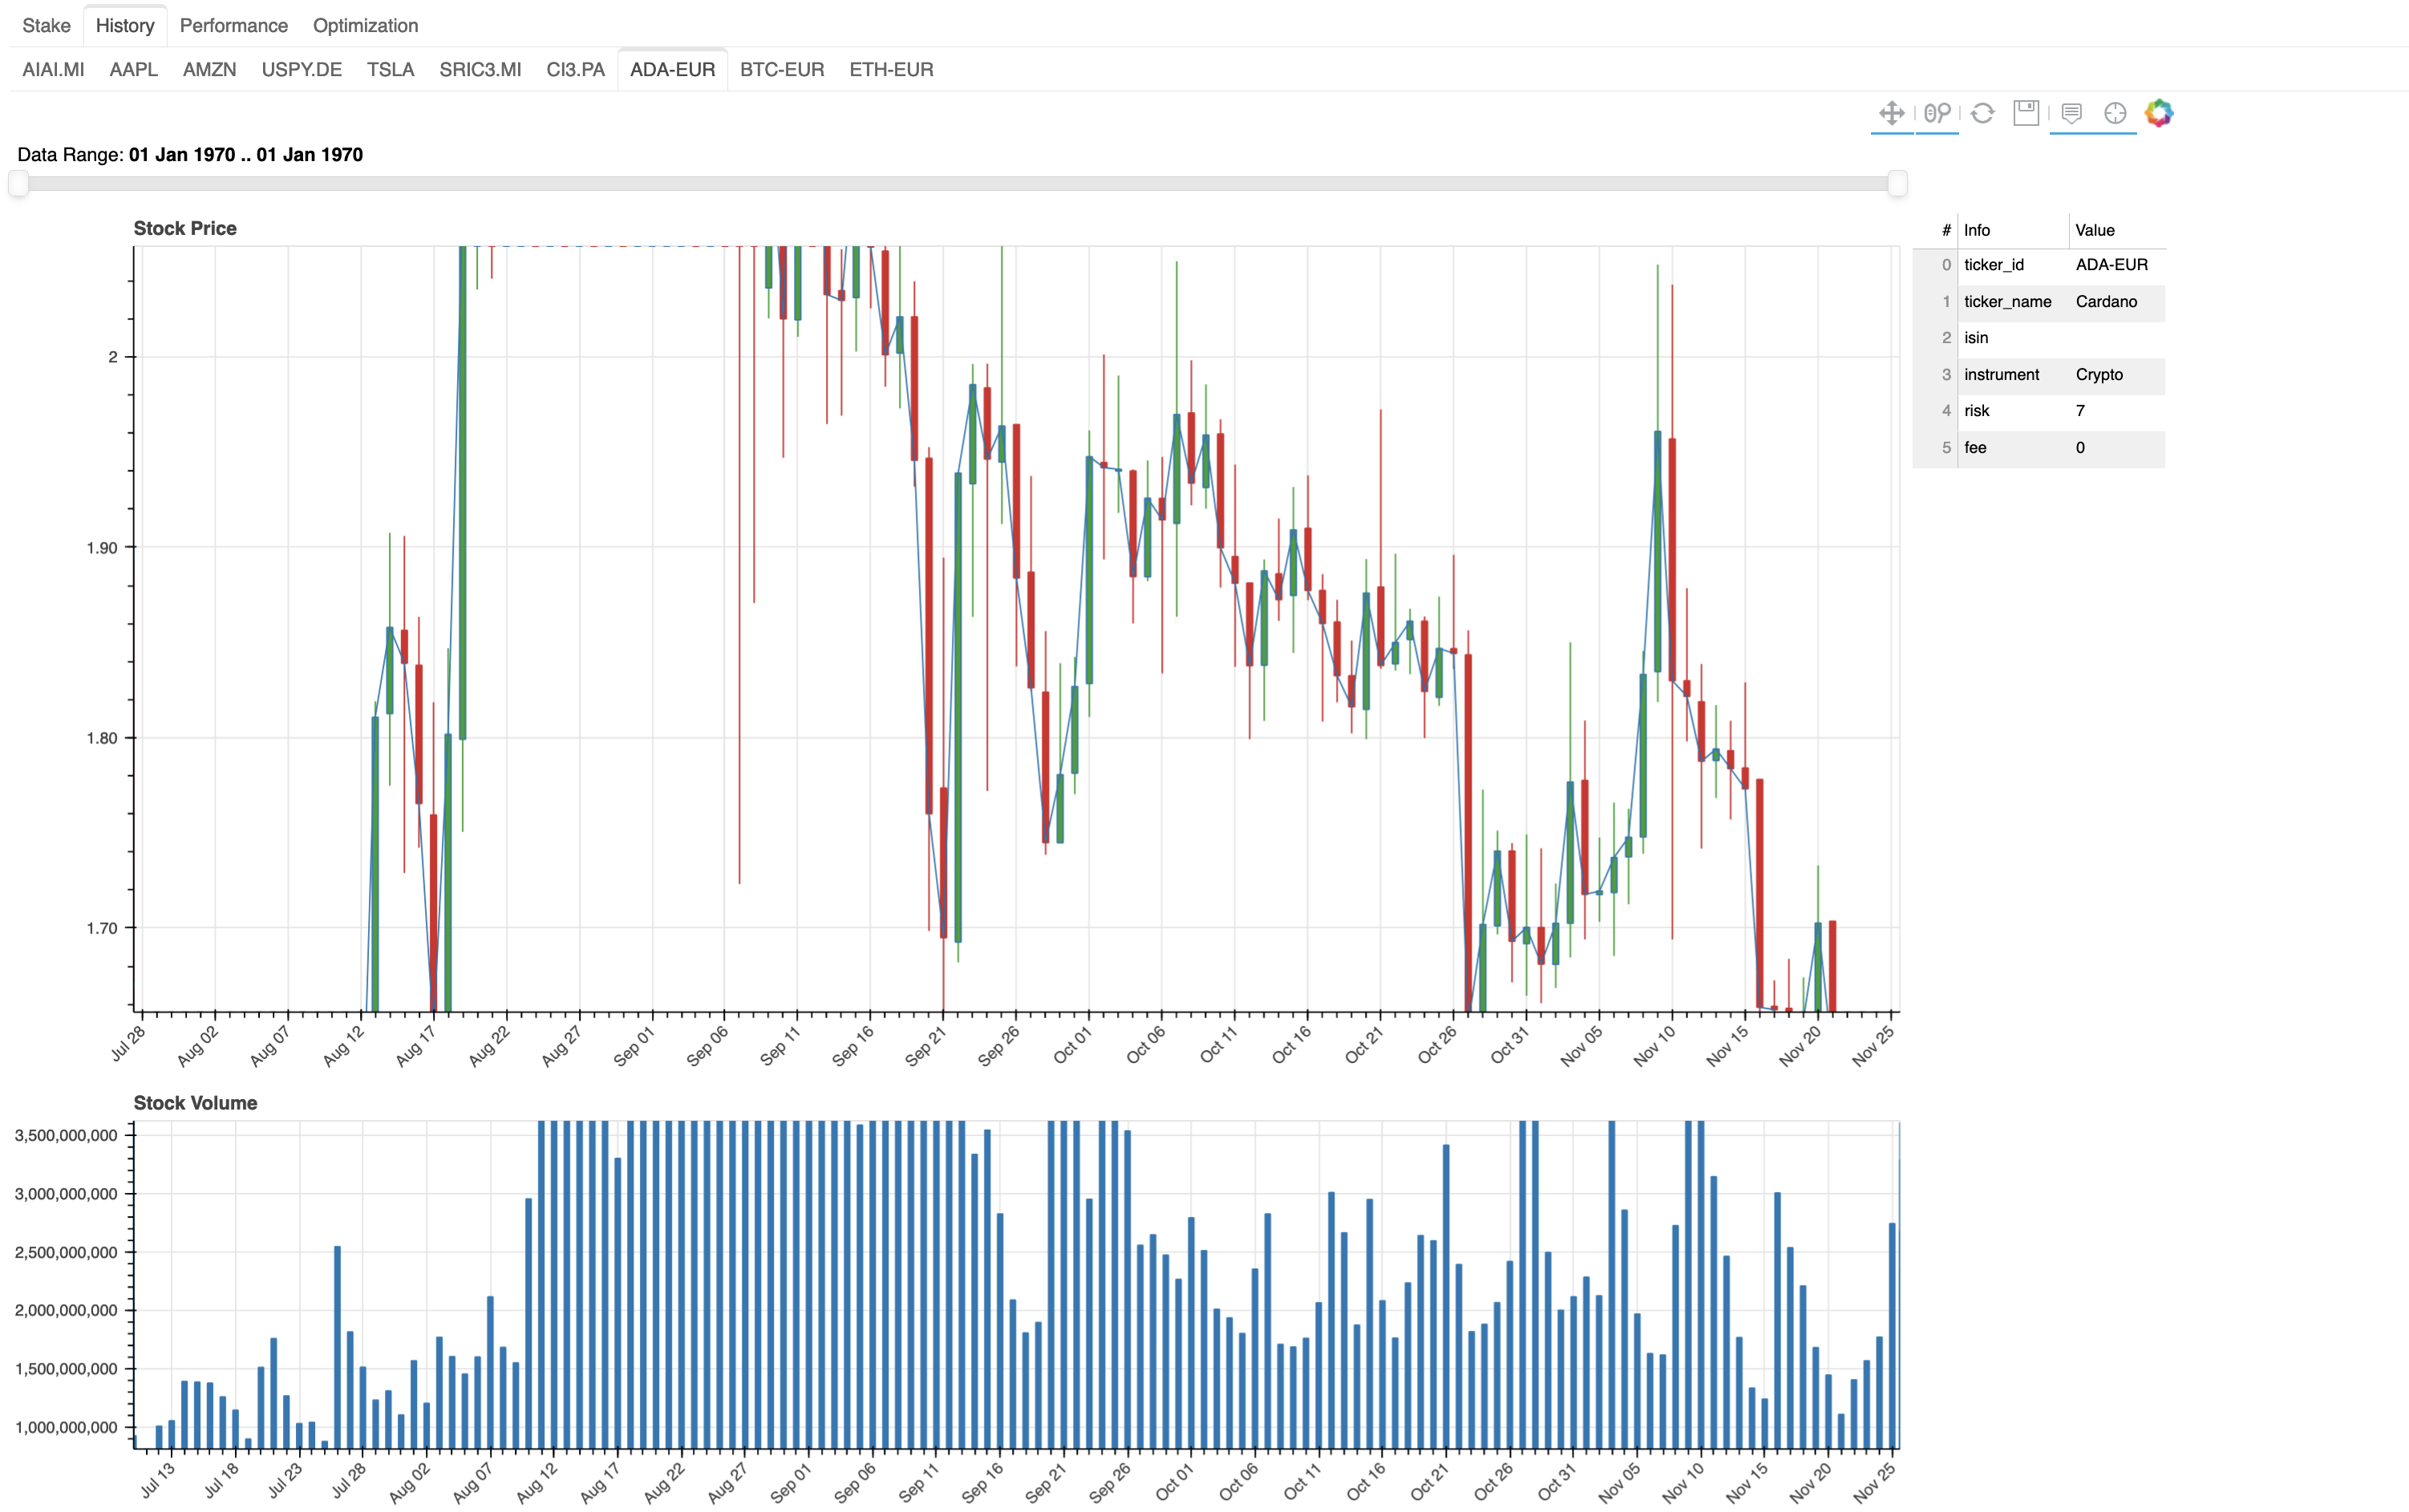
- It is possible to zoom, if the tool is active on the toolbar, as showed in the following example.
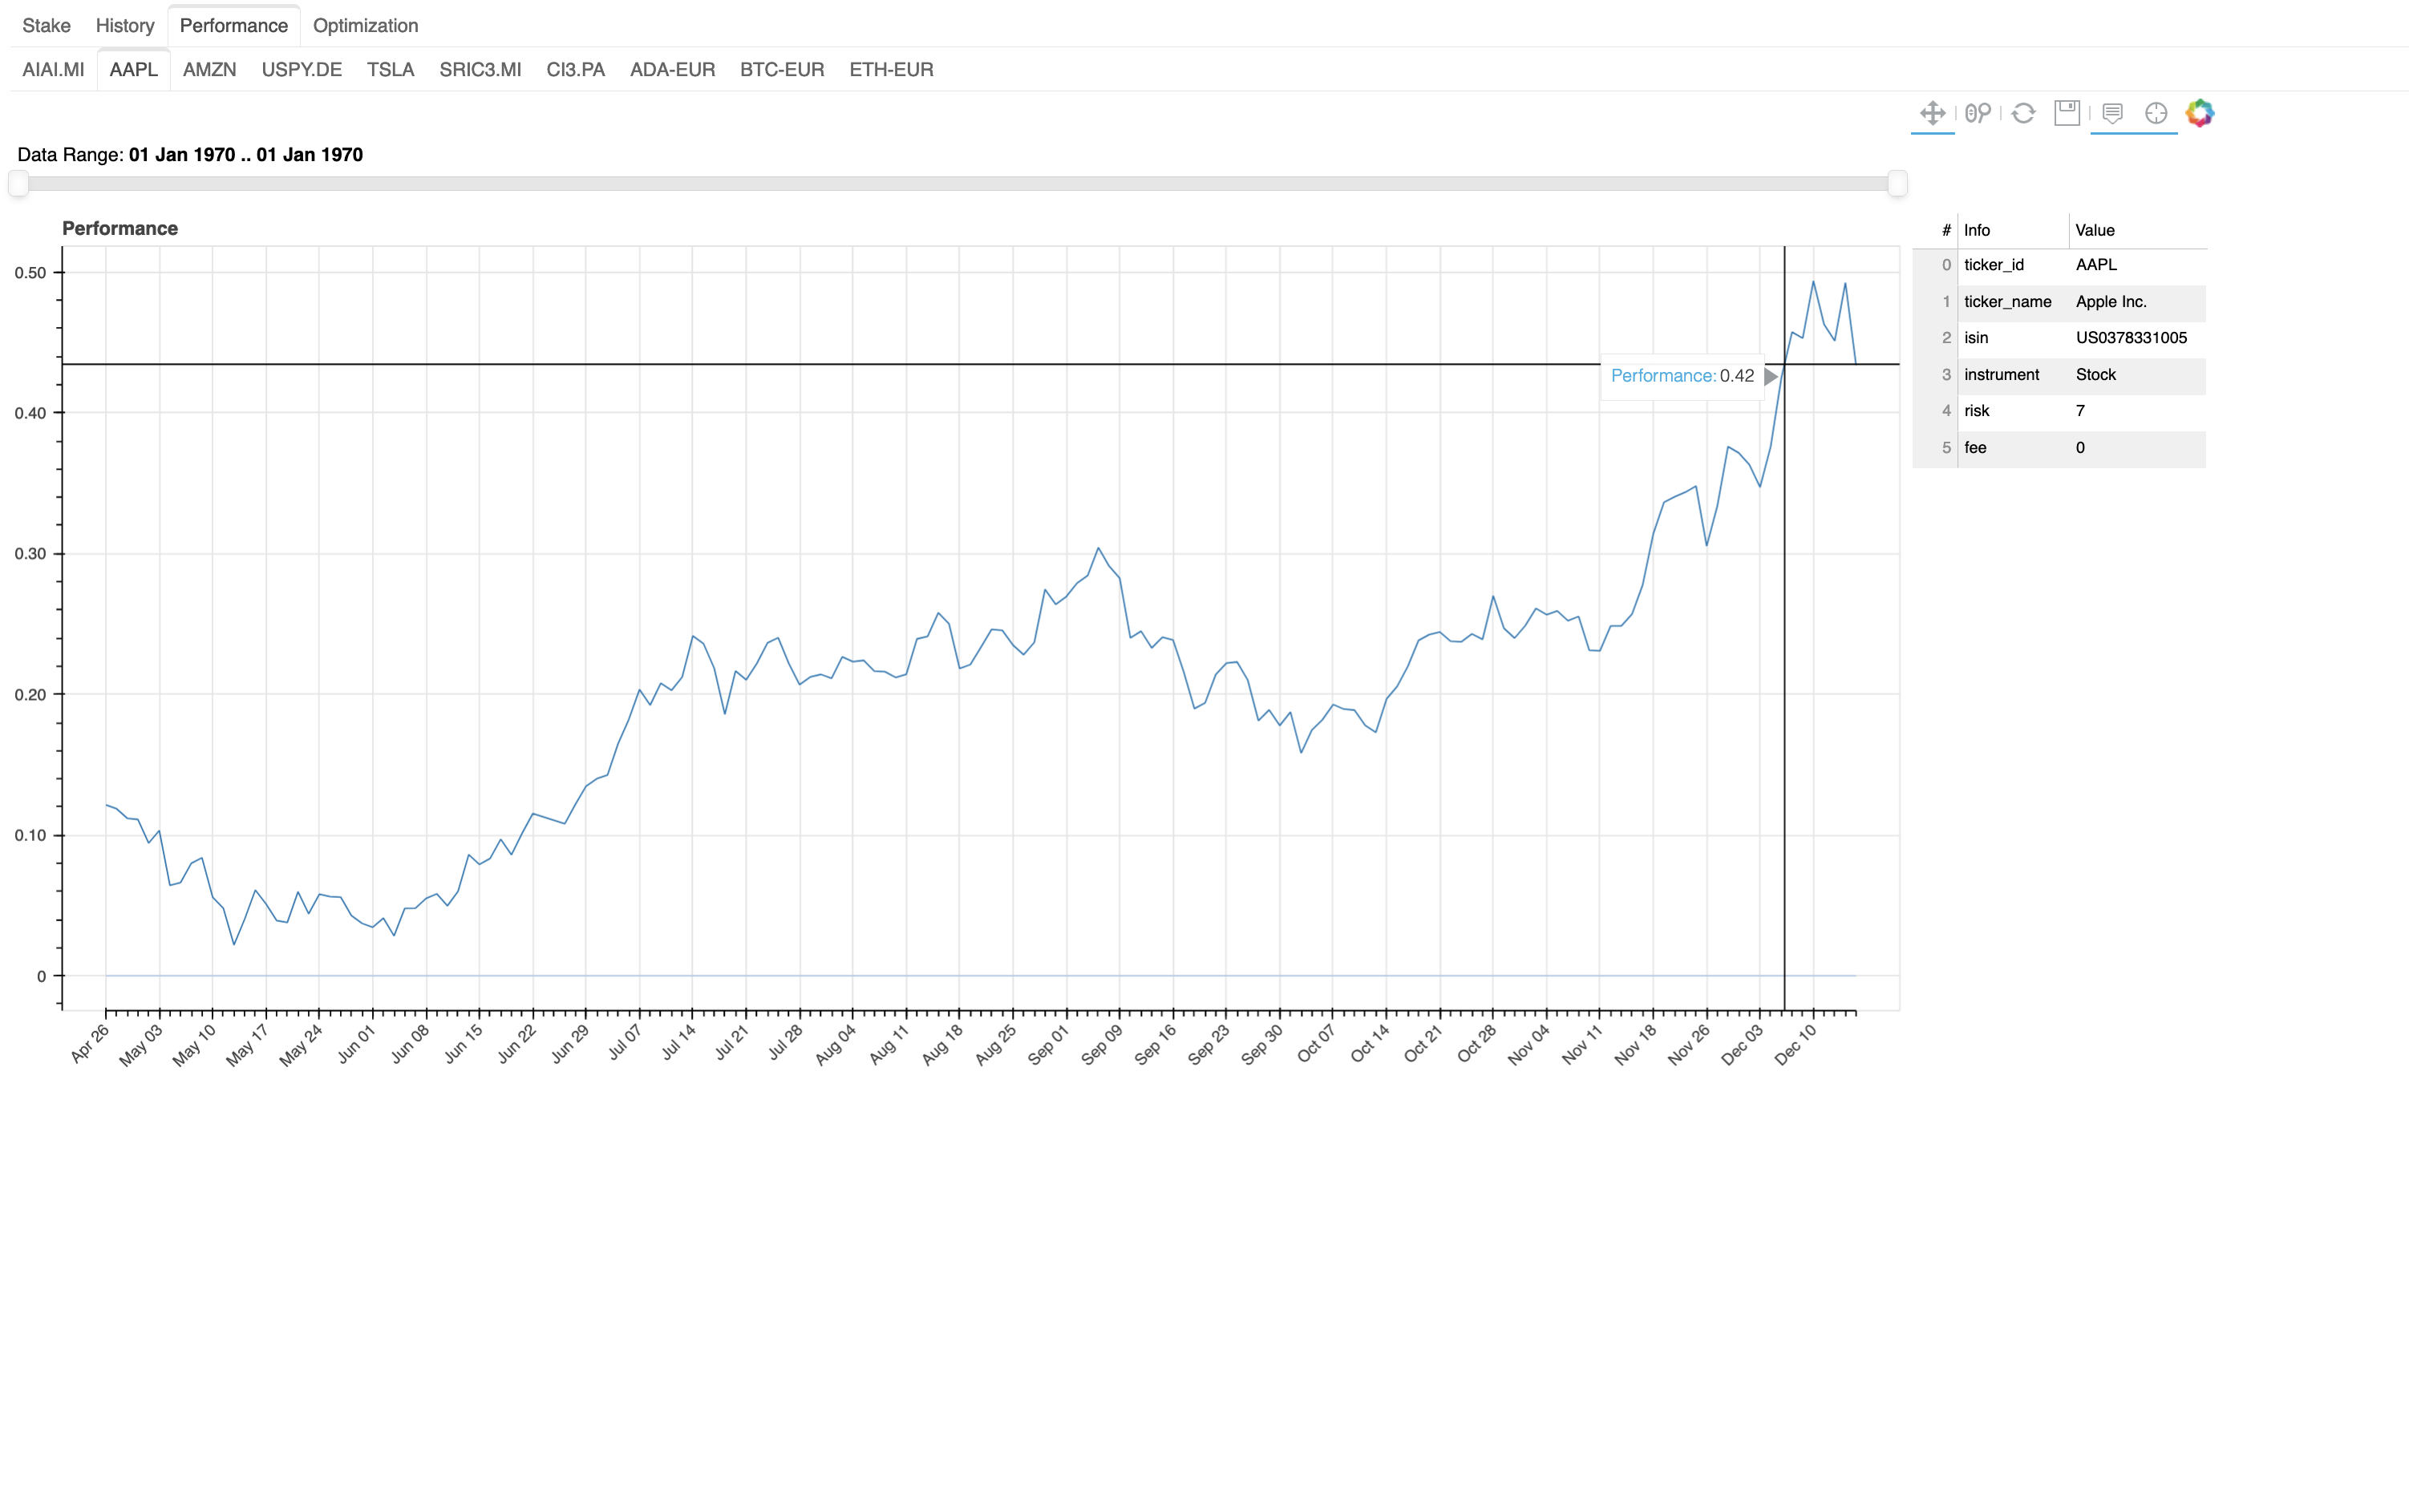
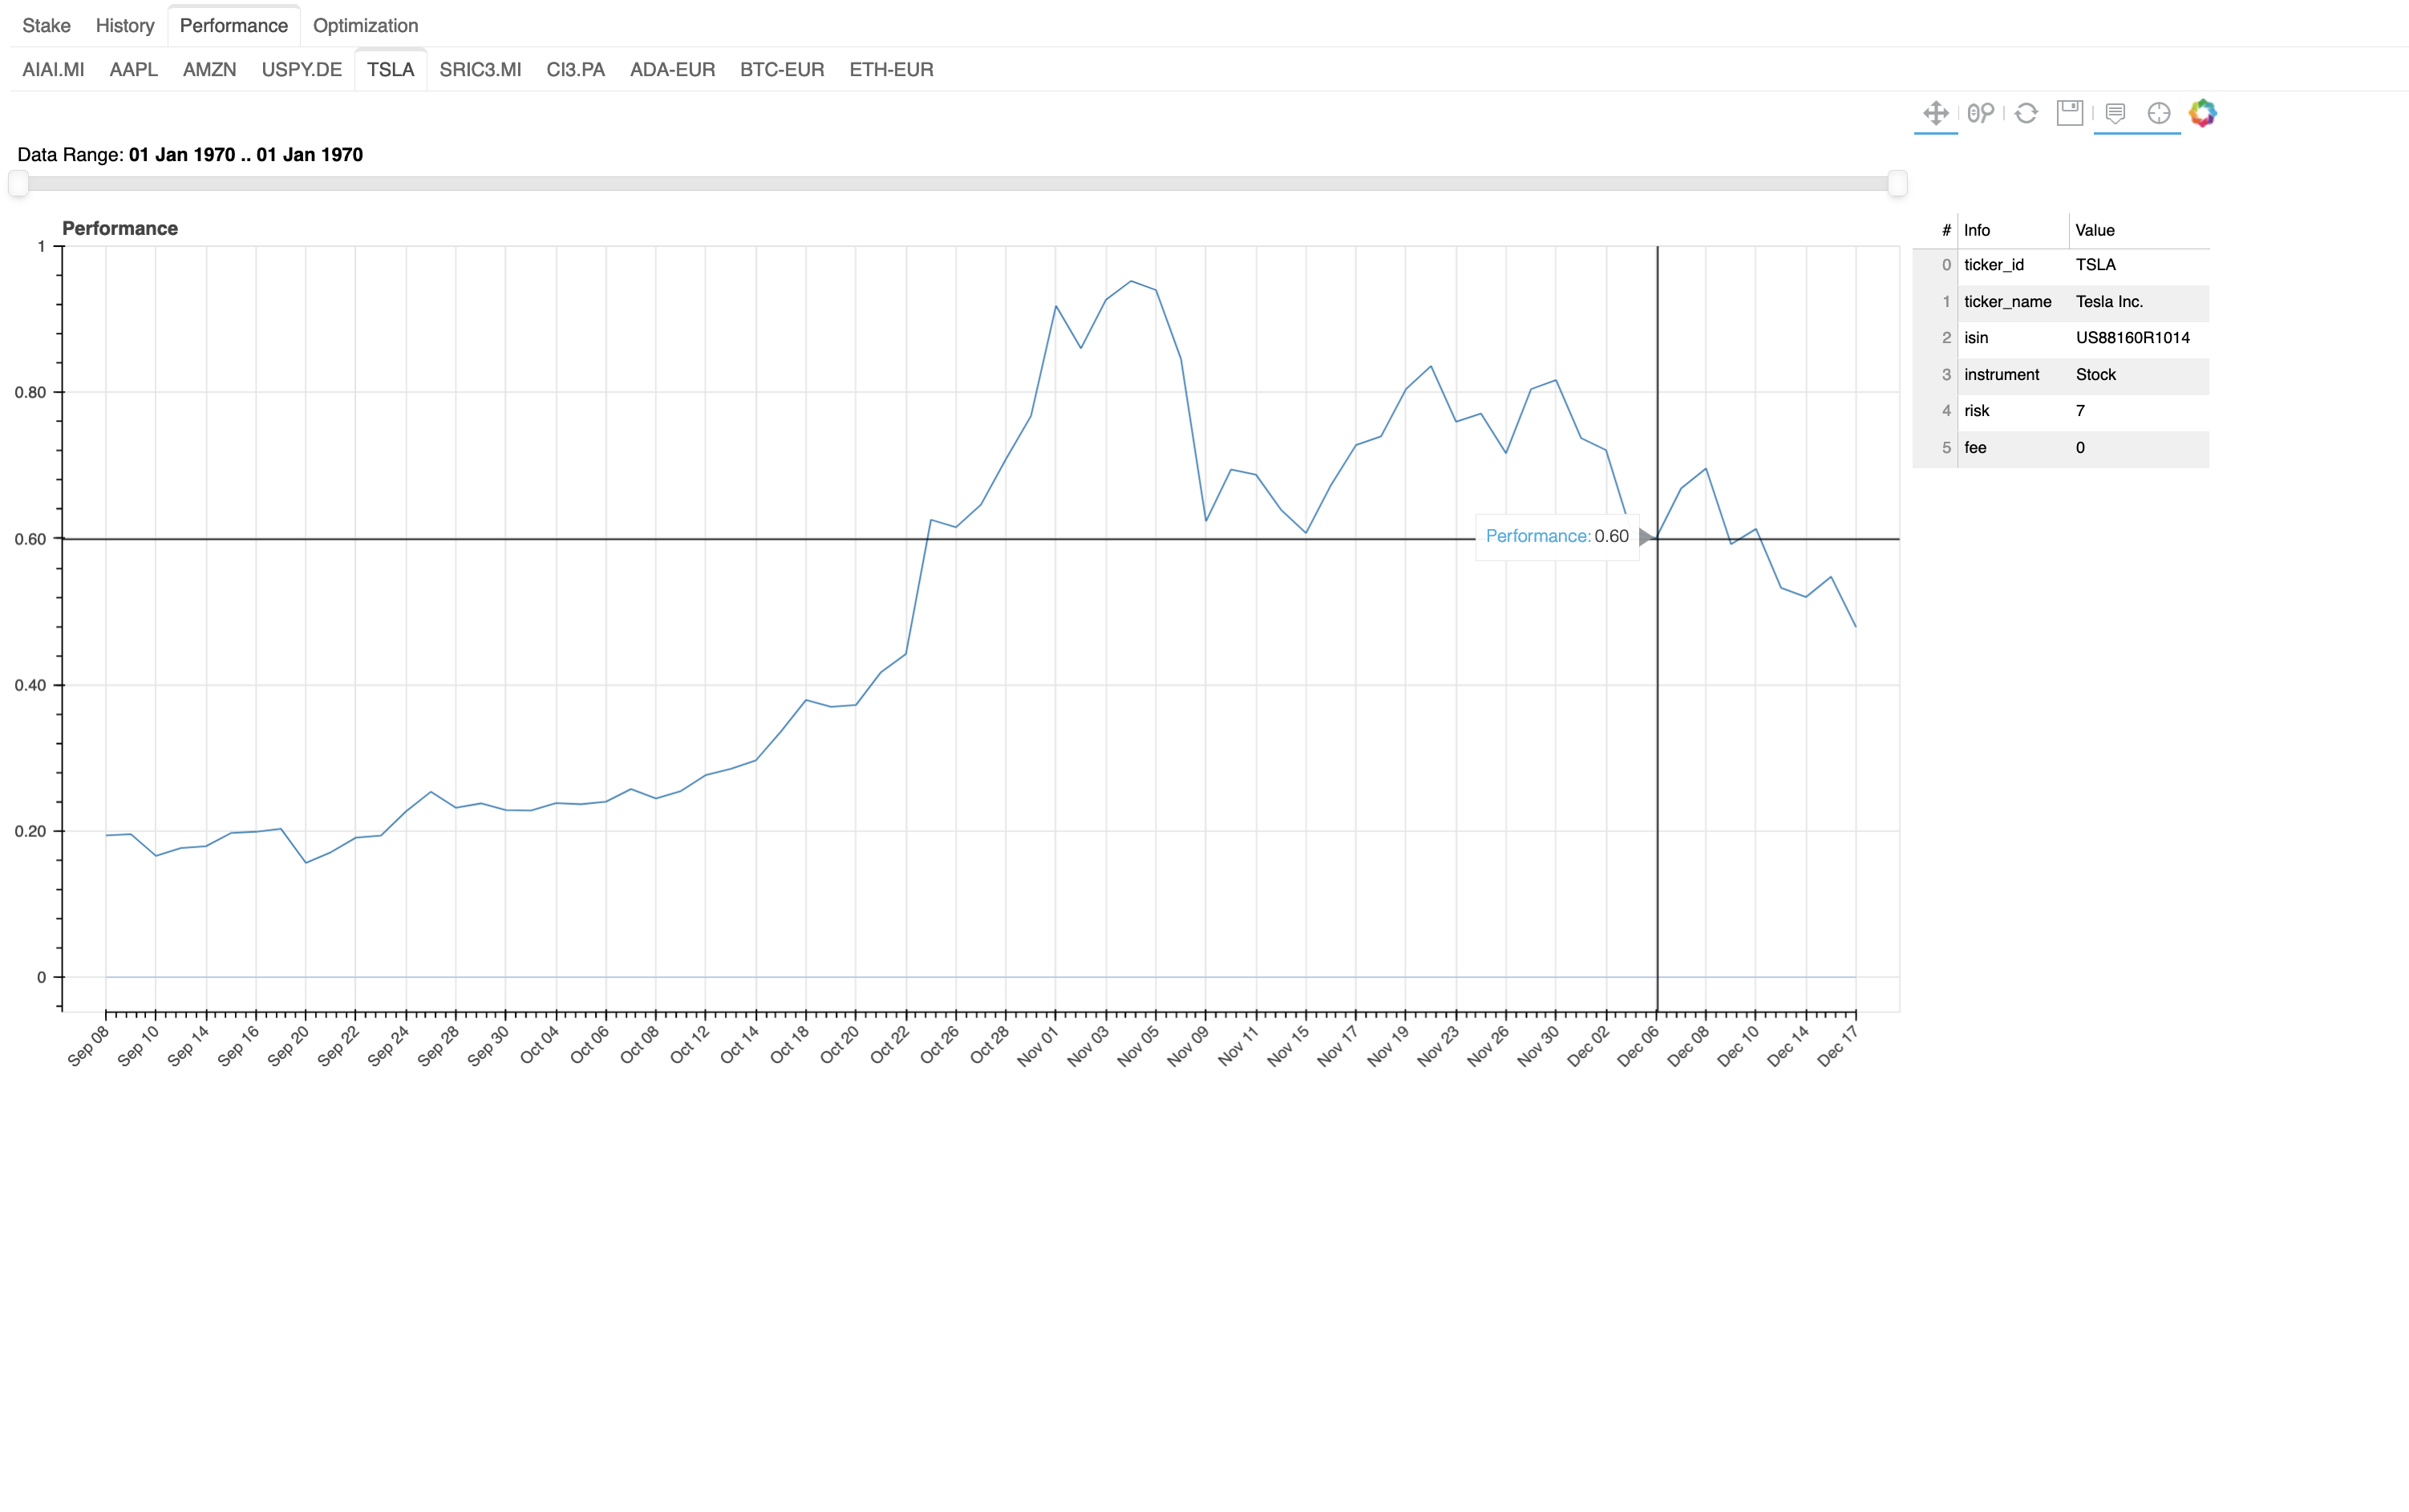
Performance Analysis
- It makes you aware of performance of each security in the financial portfolio. The hover permit to understand the value of performance in each point of the plot. Here is an example with TSLA and AAPL.
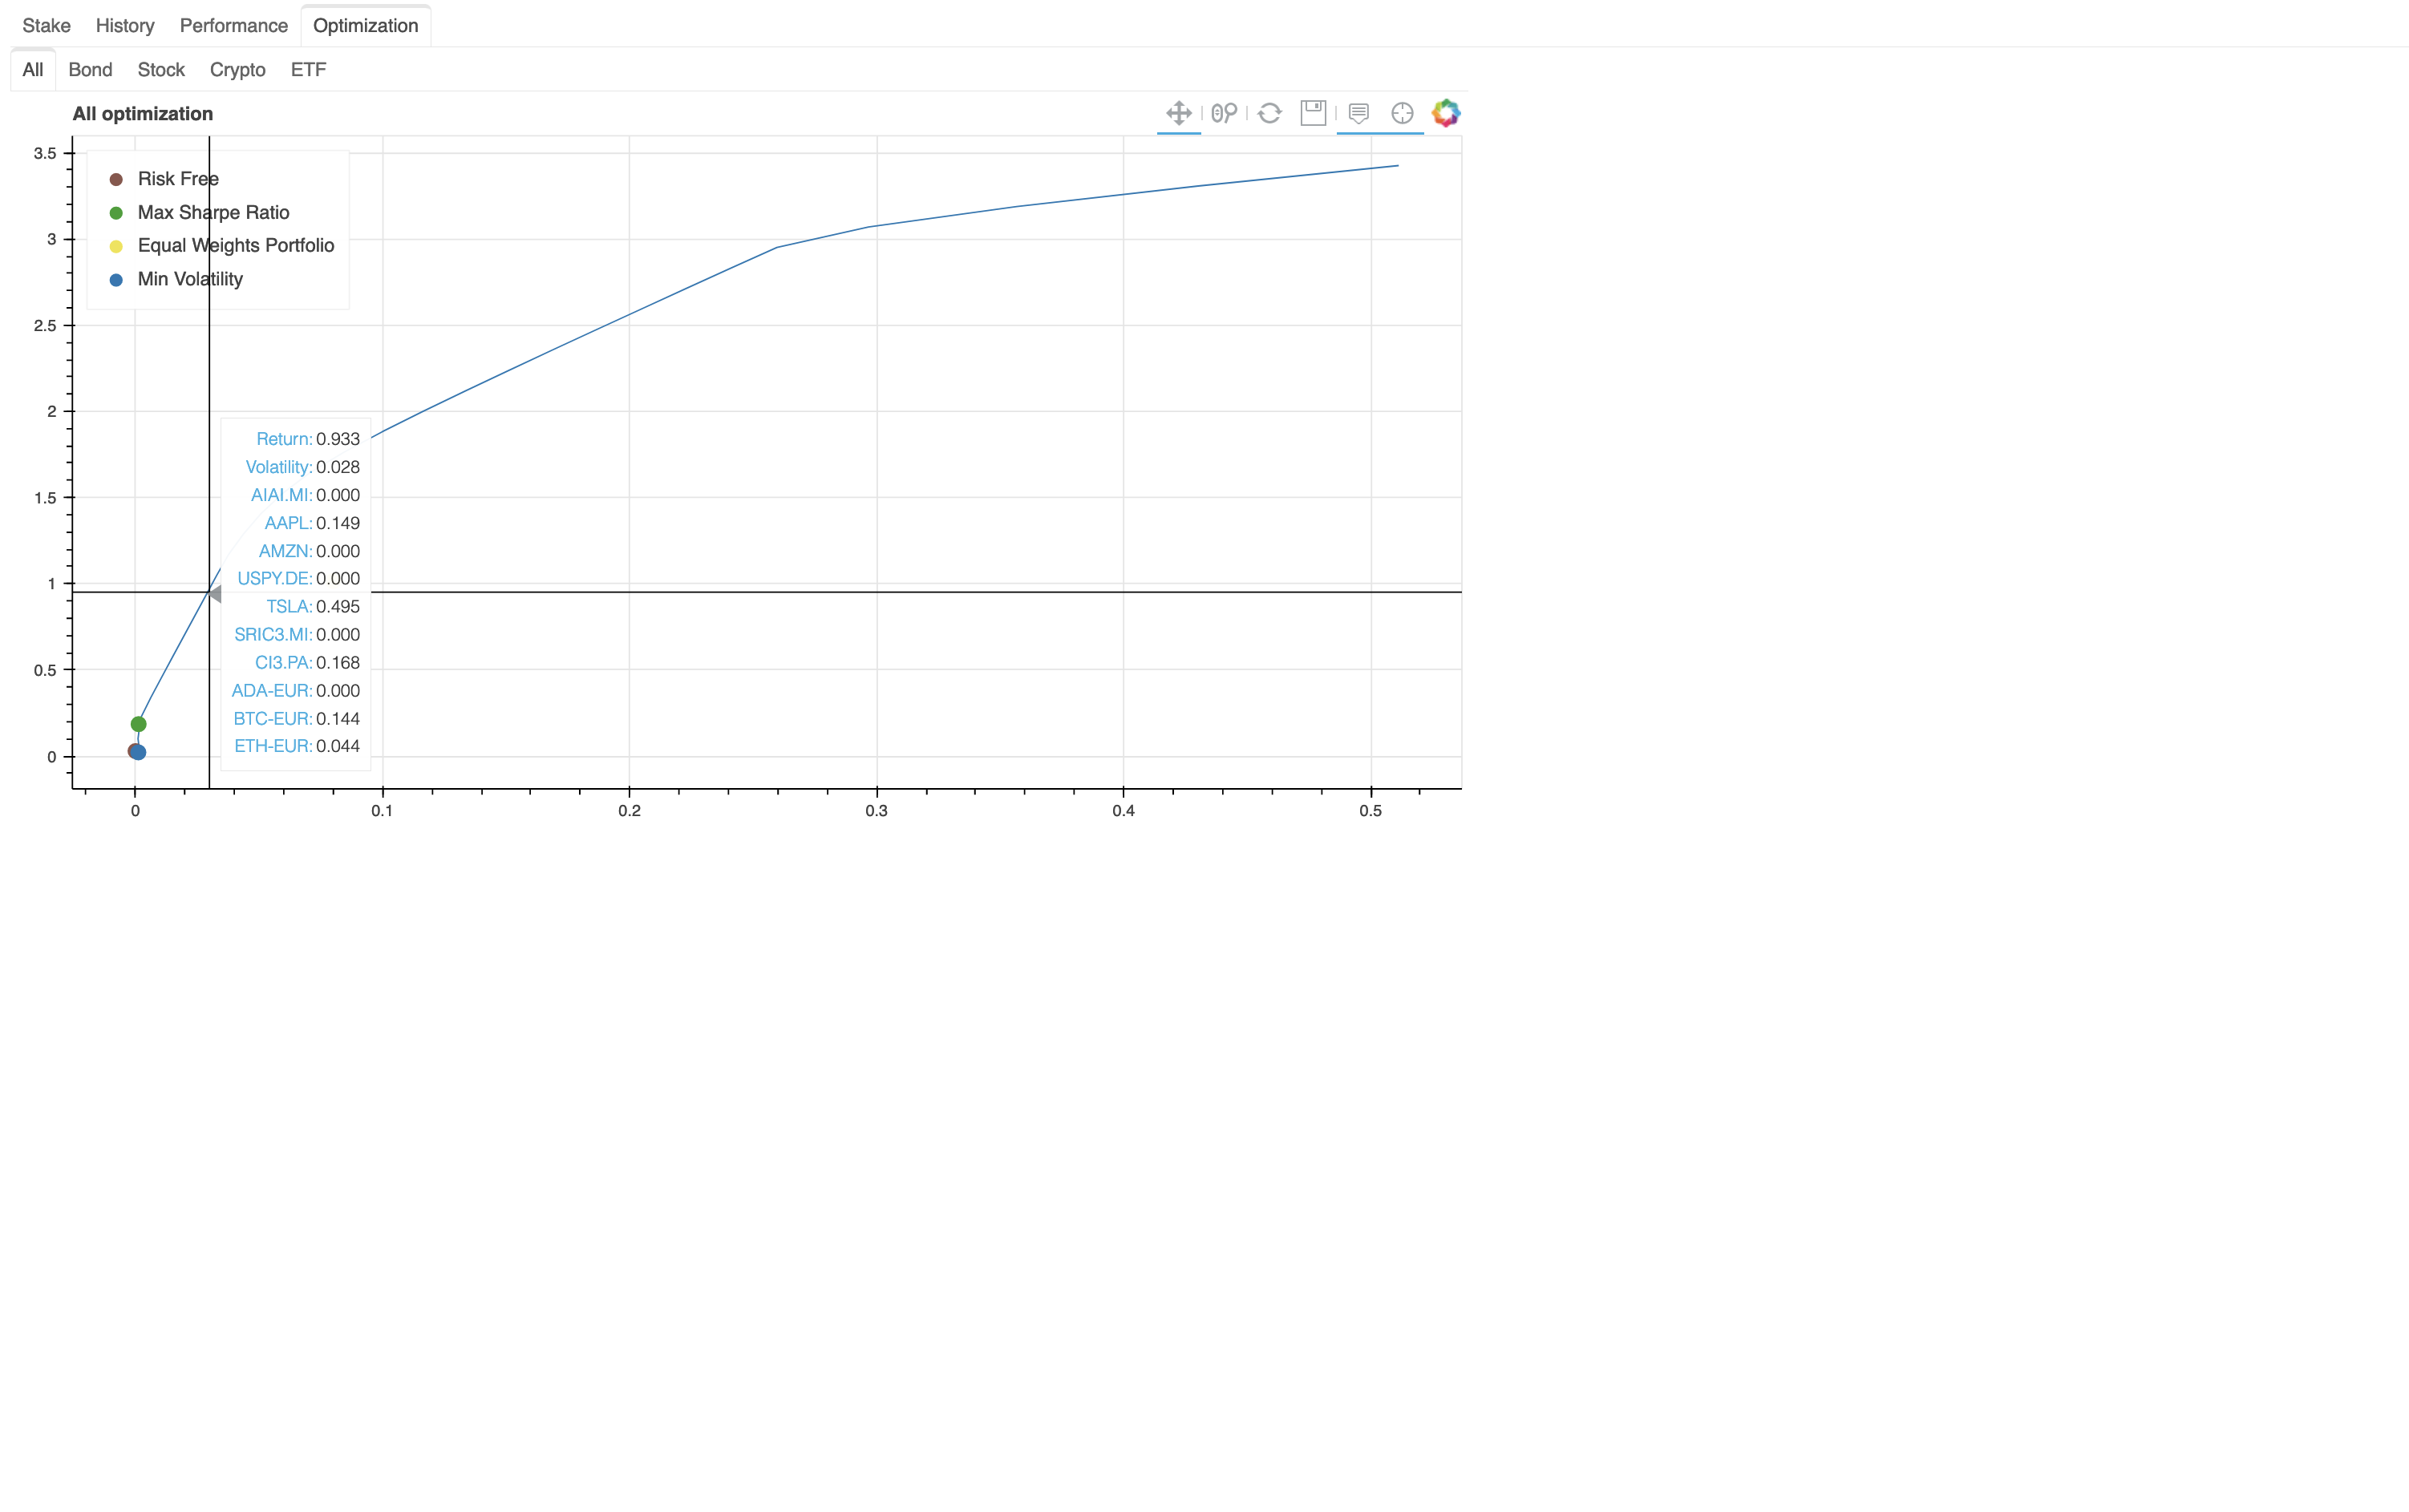
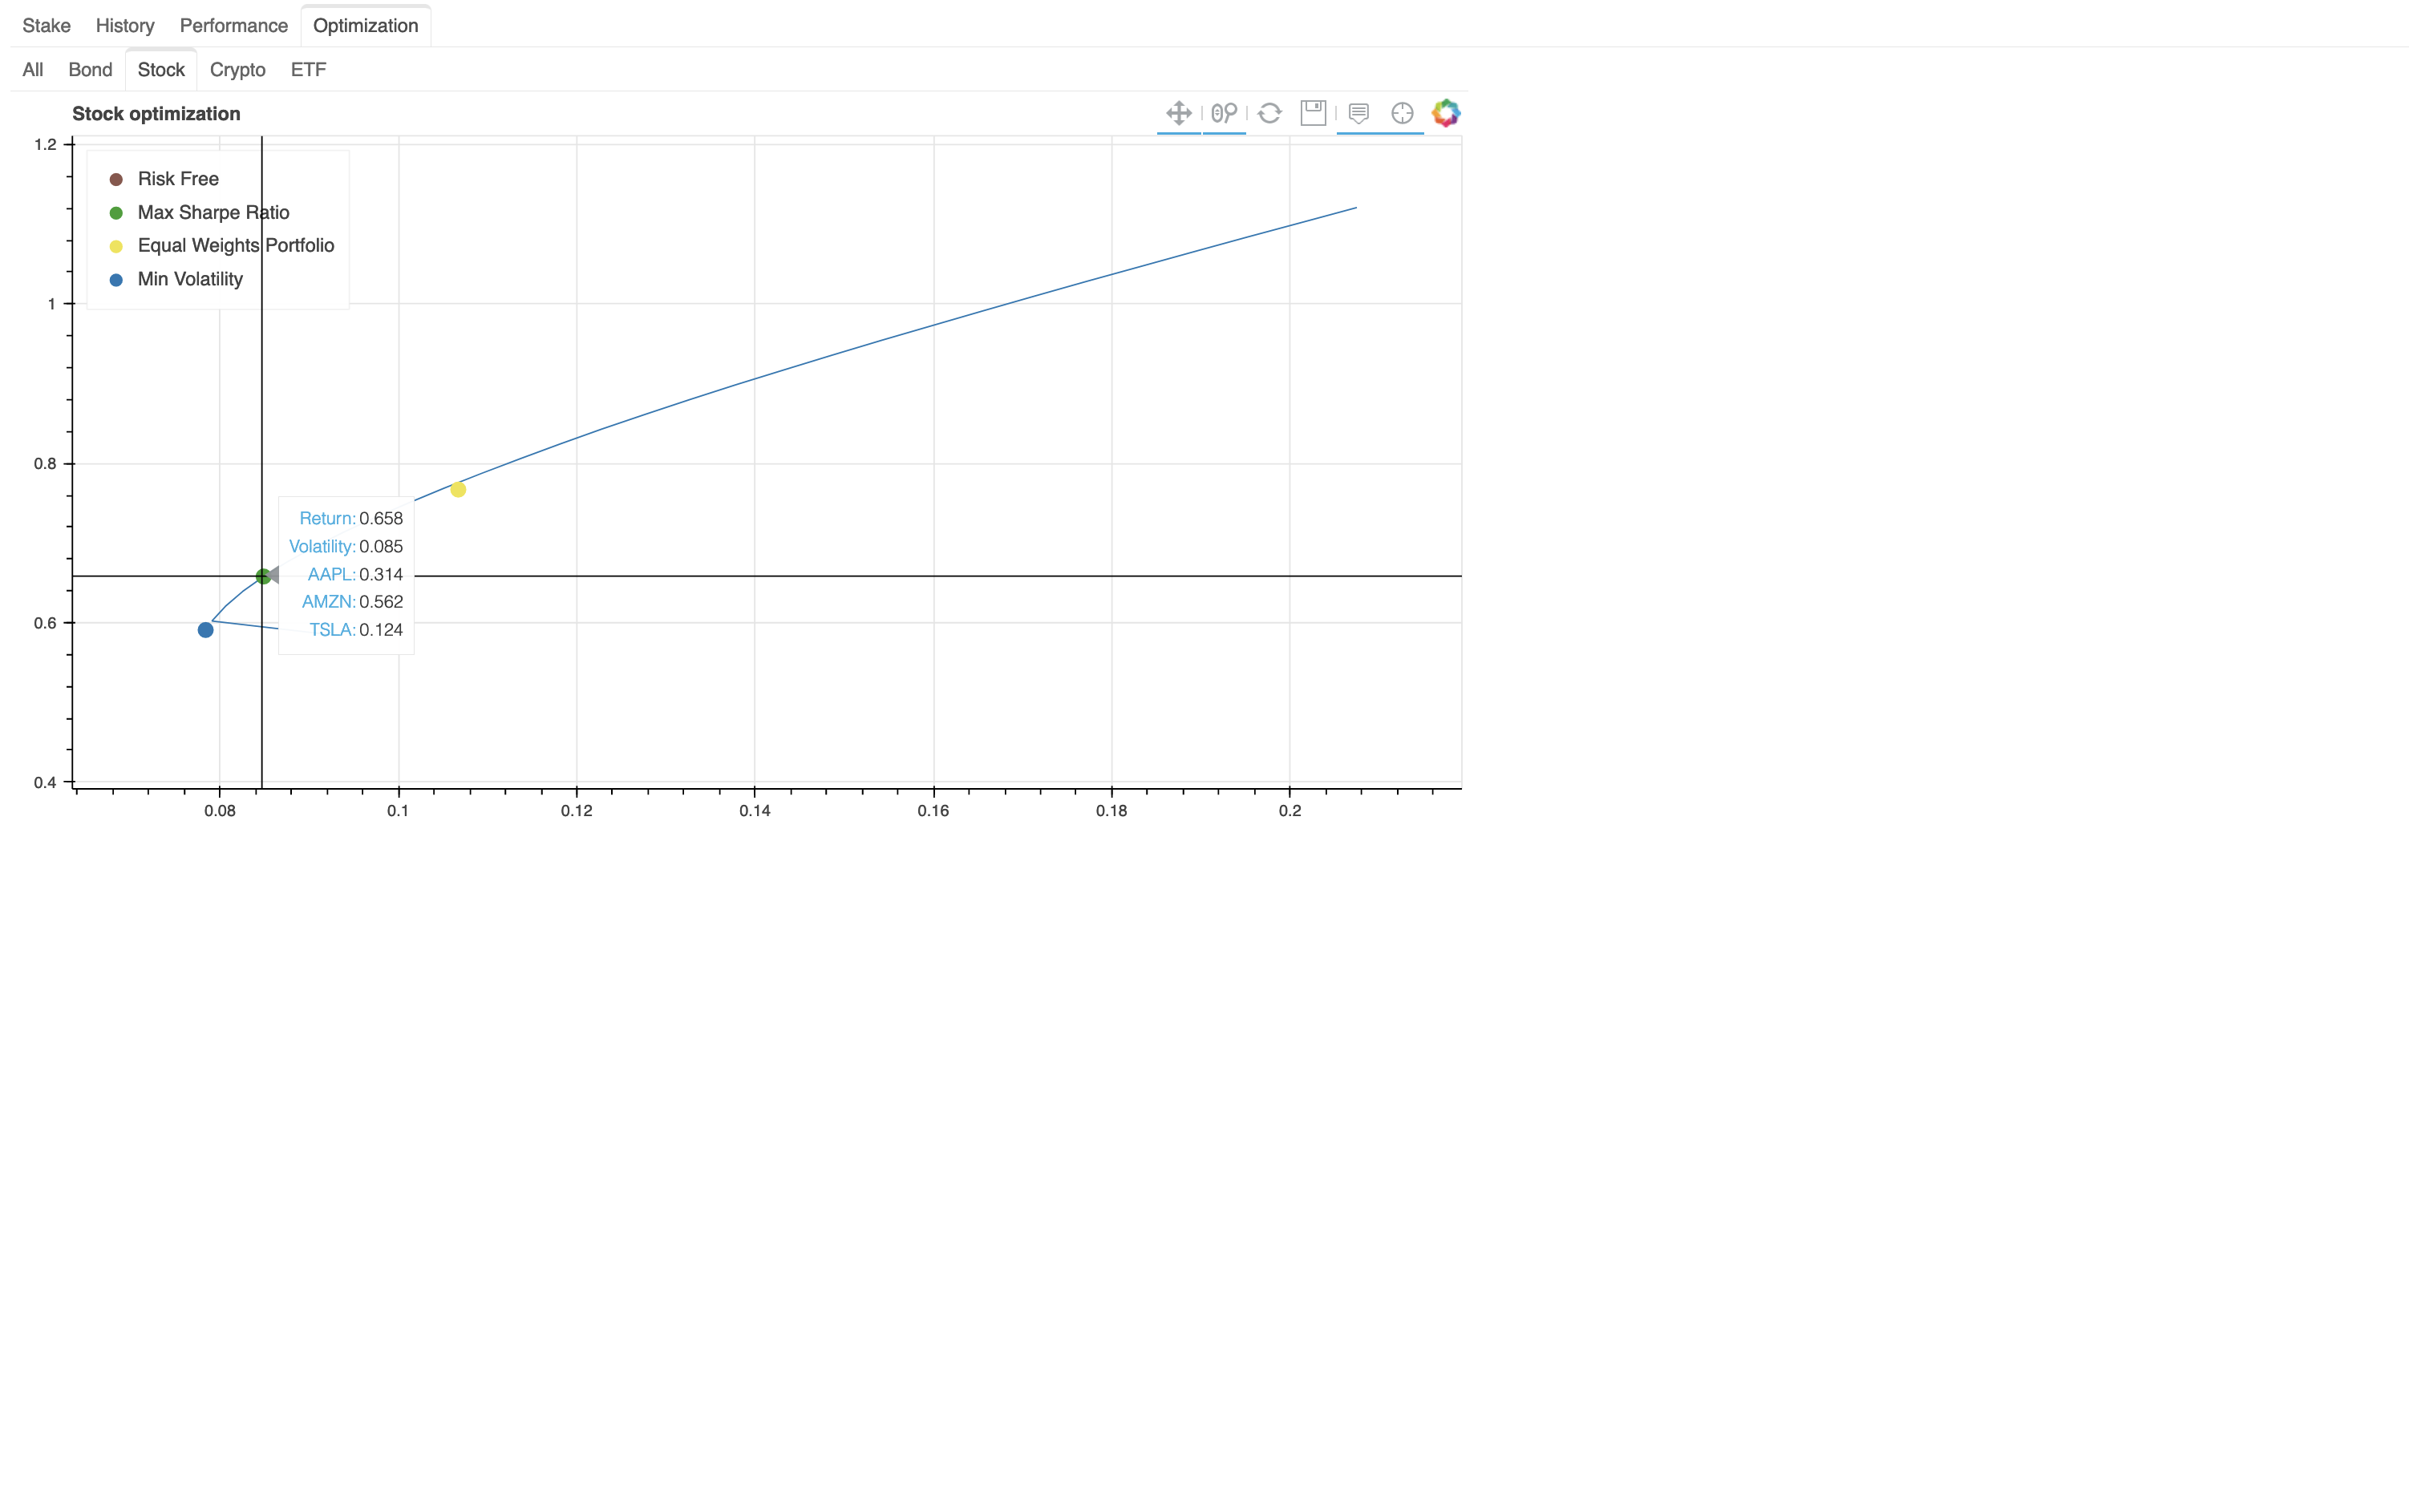
Optimization Analysis
It permits analyzing the suggested portfolio optimization. There are both optimizations for each financial categories and with all securities in the ticker_details.json. Here are two example of portfolio optimization for all securities and for stock securities.
Roadmap
Version 1.0
- [x] Portfolio stake
- [x] Portfolio performance by ticker
- [x] Ticker history data
- [x] Portfolio Optimization (Markowitz model)
Version 1.1
- [x] Fix bugs
- [x] Entire Portfolio performance
- [x] Performance for each instrument of investment
Version 2.0
- [ ] Better UI
- [ ] File management from UI
- [ ] Portfolio Optimization (RL algorithm)
Try it
- Install the requirements.txt
Create your own ticker_details.json and transactions.json (you can name them as you want)
Hint: take inspiration from tickers_test.json and transactions_test.json
Generate the static html
python3 main.py -d ticker_test.json -t transactions_test.json -u -o outputs/portfolio_analysis.html[-u --> update historical data]
- Have fun!
![]()
Contribution
If you want to contribute in this project for the next release, feel free to contact me. You find my contact at the contact section in my portfolio.
I need someone who can help me in:
- Frontend development
- Server infrastructure
Author
Daniele Moltisanti